01 What is Time Price Opportunity?
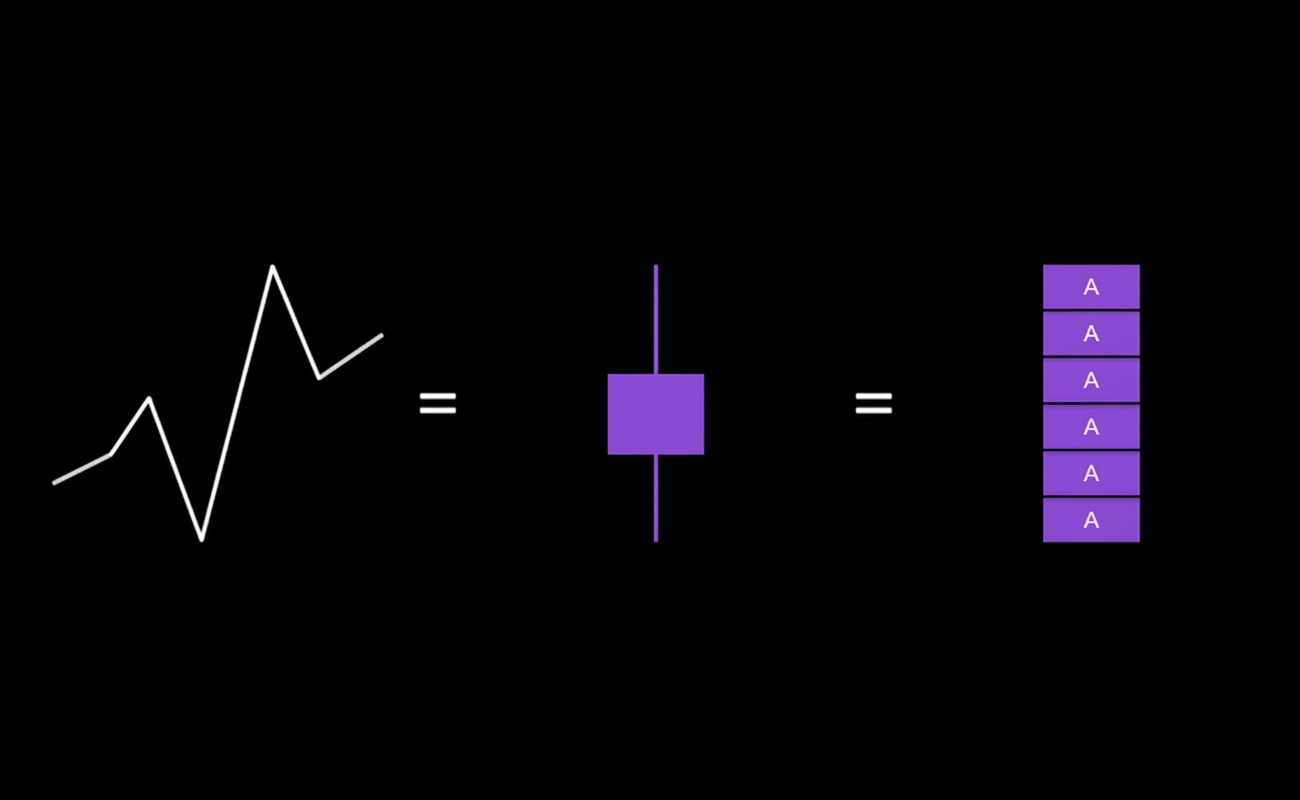
Time Price Opportunity (TPO), also referred to as Market Profile, is a market analysis tool used to visualize how long price is accepted at different levels throughout a trading session. It organizes price activity horizontally by time spent at each price, rather than by traded volume, revealing where the market has spent the most and least time facilitating trade.
TPO represents the number of time periods (typically letters or blocks) that price trades at a given level during a session. These time periods are most commonly based on 30 minute intervals, with each bracket representing one segment of the session. Each occurrence reflects that the market revisited and accepted that price for a period of time.
02 Market Profile Components
Value Area
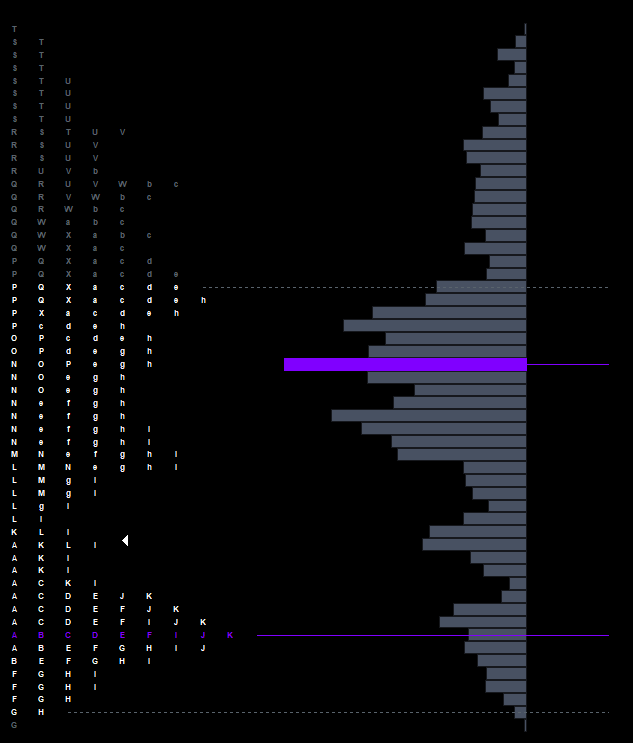
The Value Area represents the range of prices where the majority of trading activity has occurred during a given session. It reflects the zone in which buyers and sellers were most willing to transact, indicating broad agreement on price and efficient trade facilitation. When price remains within this area, market activity is typically rotational rather than directional.
Single Prints
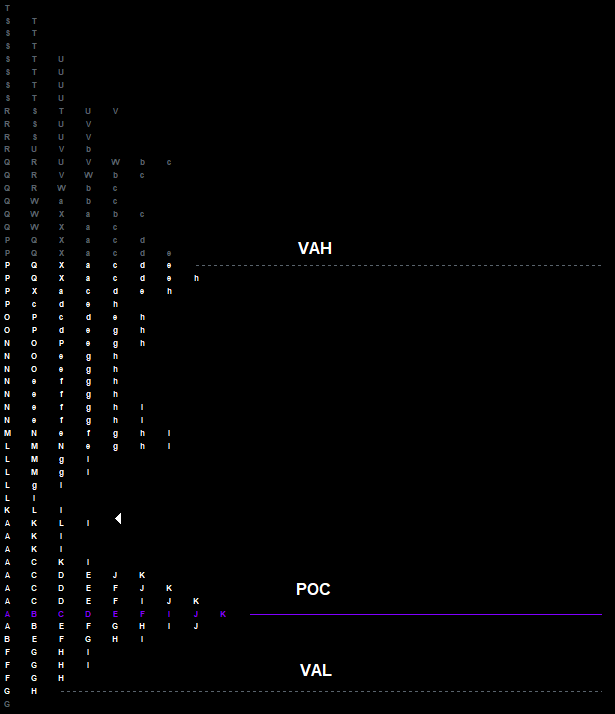
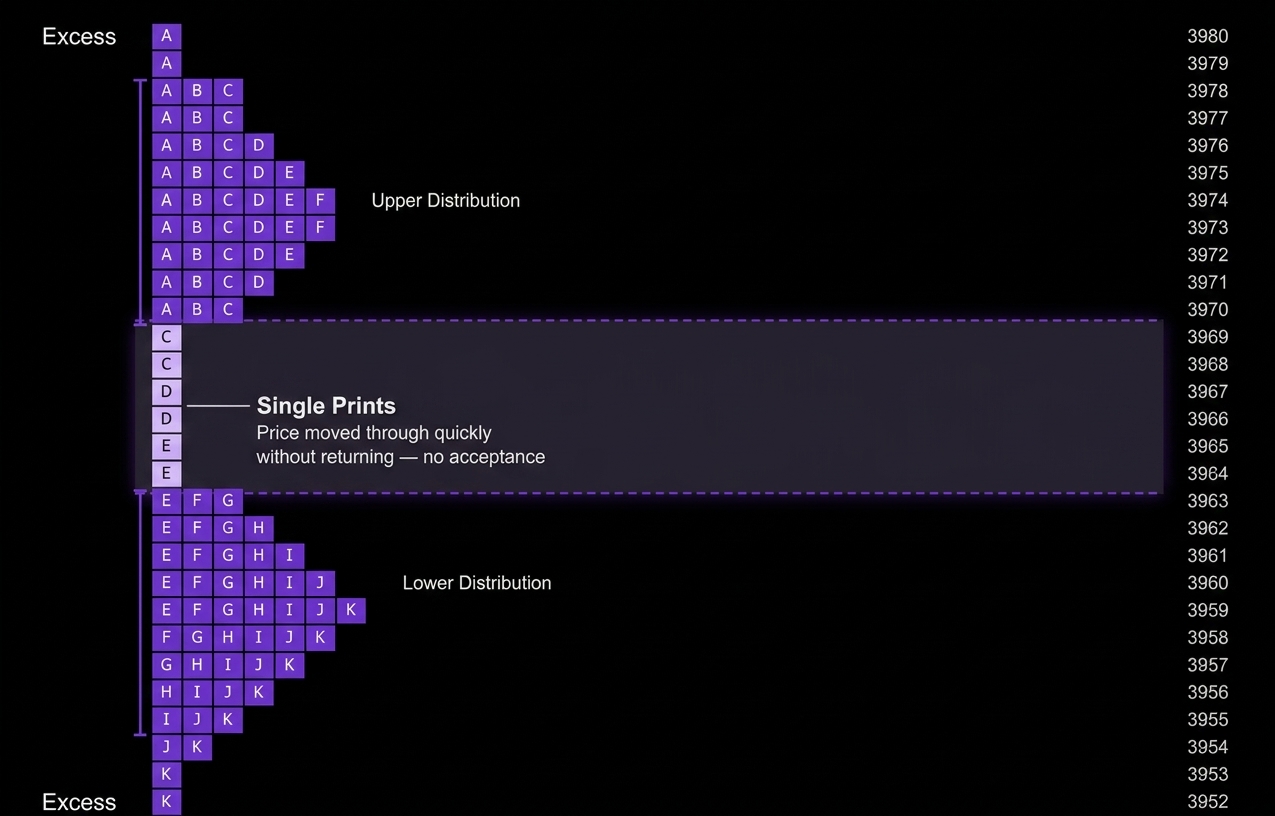
Single prints are price levels where only one TPO letter appears in the profile. They represent areas where the market moved through price quickly without returning, indicating a lack of acceptance and rapid directional movement. Single prints are the TPO equivalent of Low Volume Nodes in Volume Profile.
Excess
Excess occurs when the market reaches an extreme and is met with strong opposing participation, creating a sharp rejection. On a TPO profile, excess appears as a tail of two or more consecutive levels where only one period traded before the market reversed at the very top or bottom of the profile.
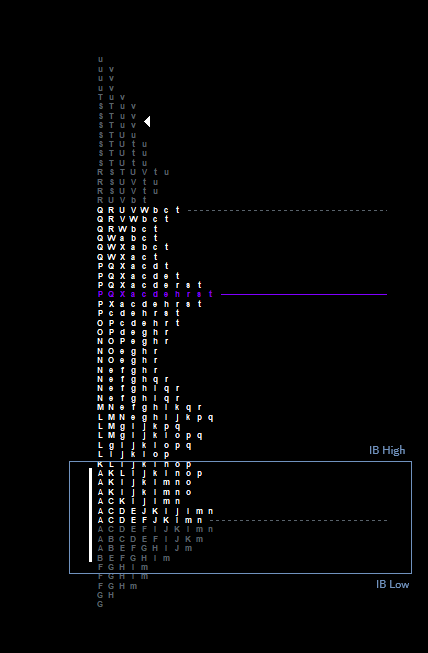
Initial Balance (IB)
The Initial Balance represents the first hour of trading...
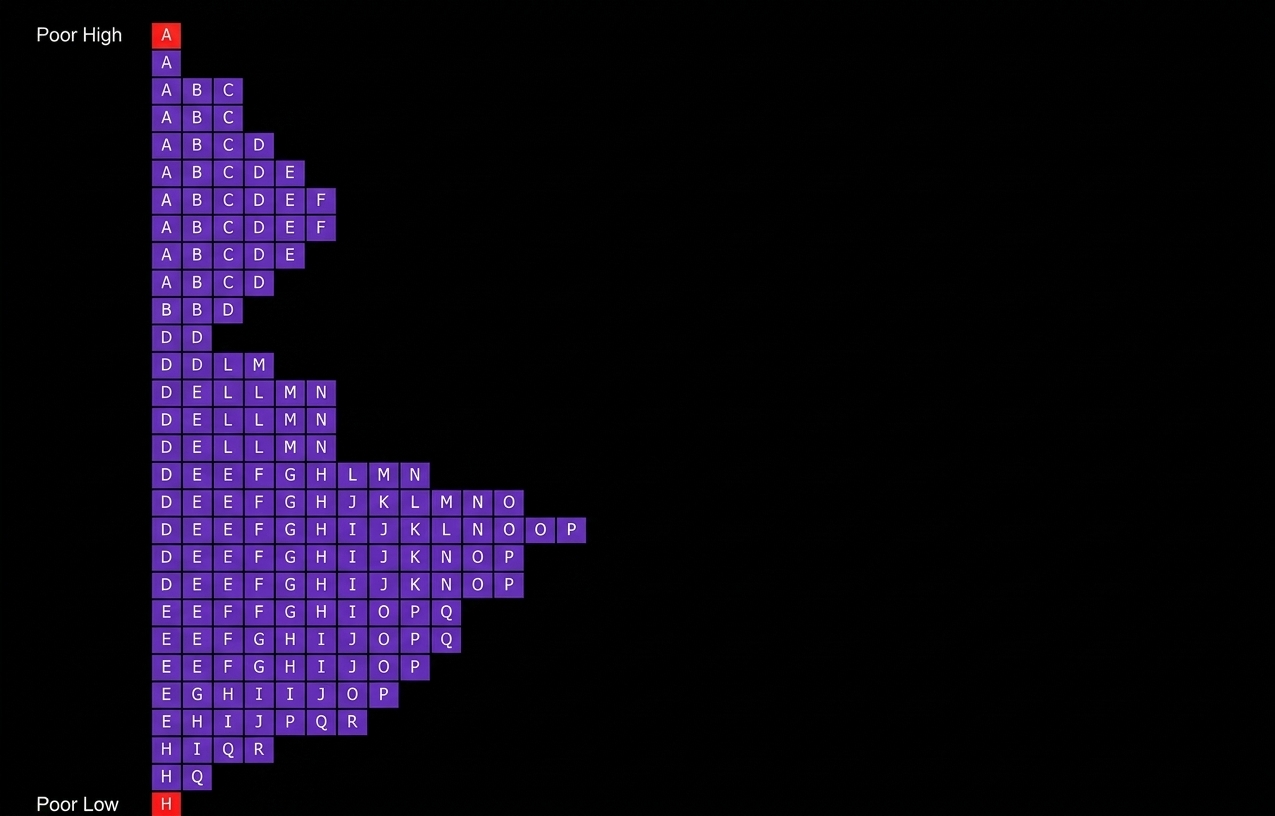
Poor Highs & Poor Lows
A Poor High or Low occurs when the profile extreme lacks an 'Excess' tail...
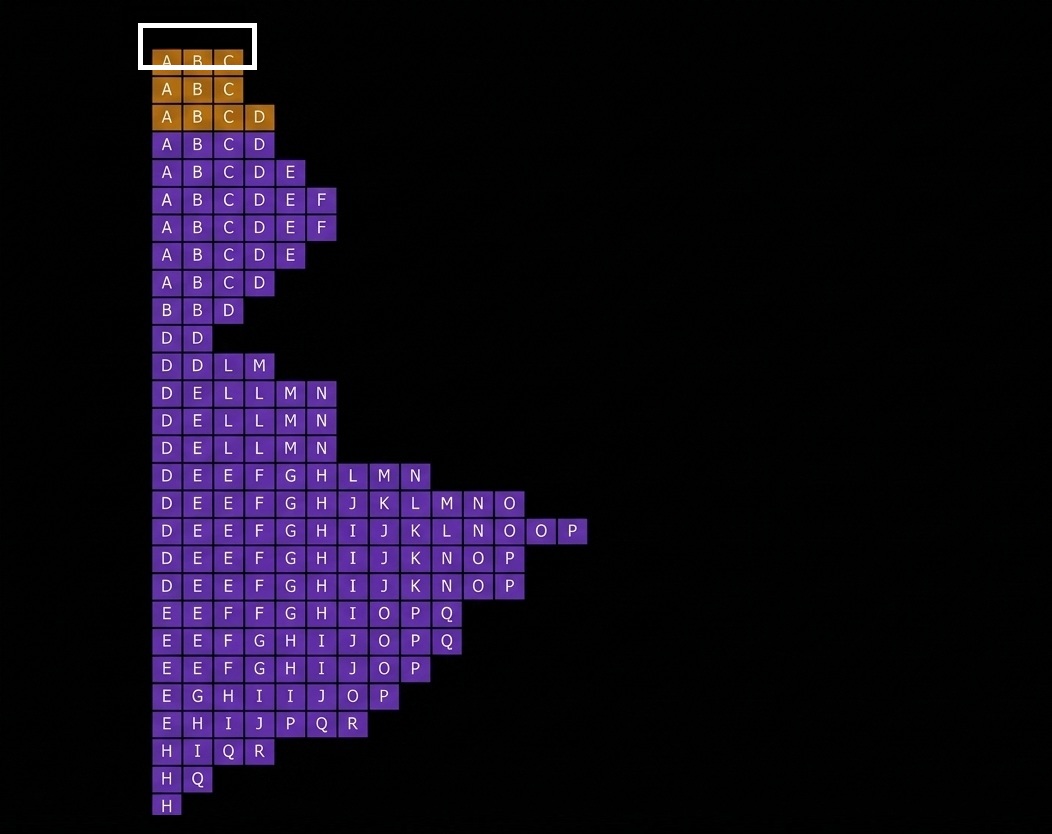
Unfinished Auction
An Unfinished Auction happens when the exact extreme...
Anatomie Interactive du Market Profile (TPO)
Cliquez ou survolez les boutons sous le profil pour visualiser et décomposer chaque élément clé de la distribution.
Cliquez ou survolez un bouton sous le graphique pour afficher l'analyse détaillée du composant.
03 Market Profile Configurations
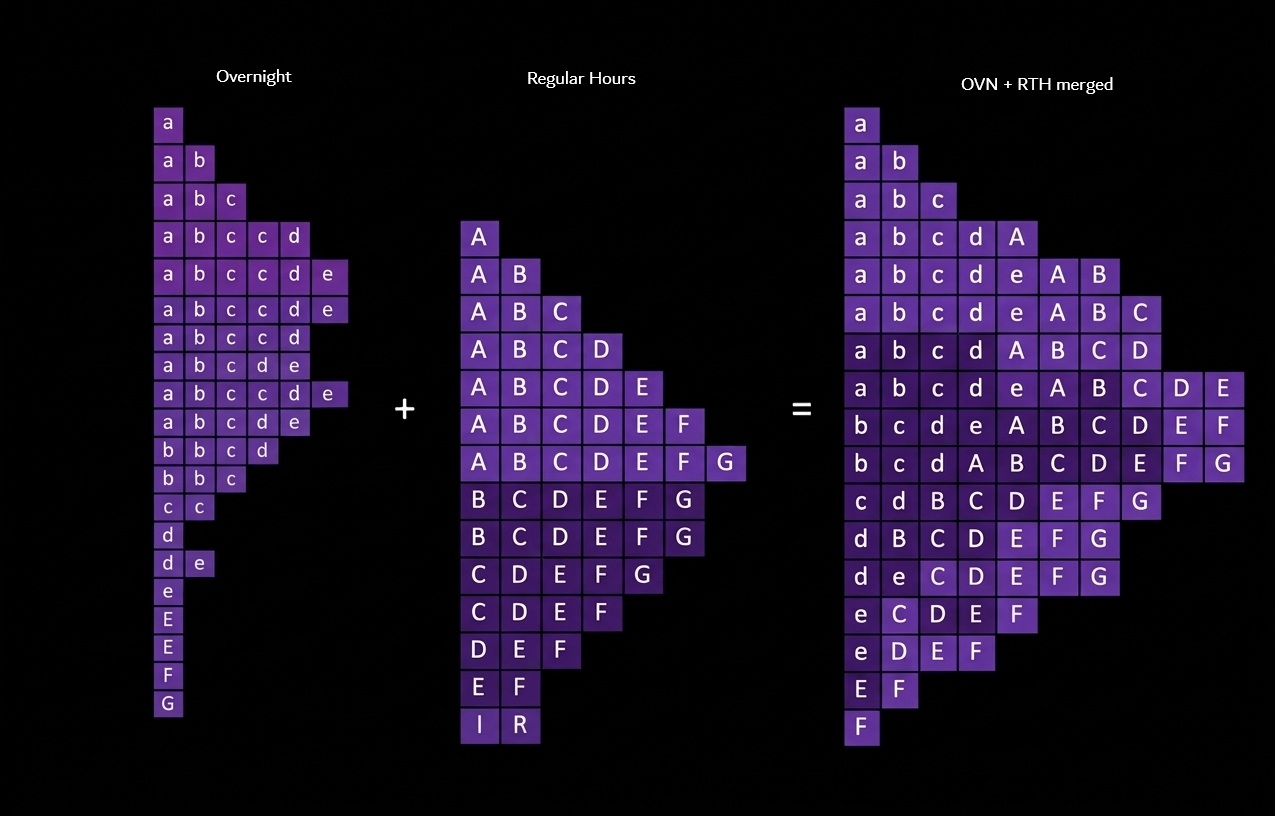
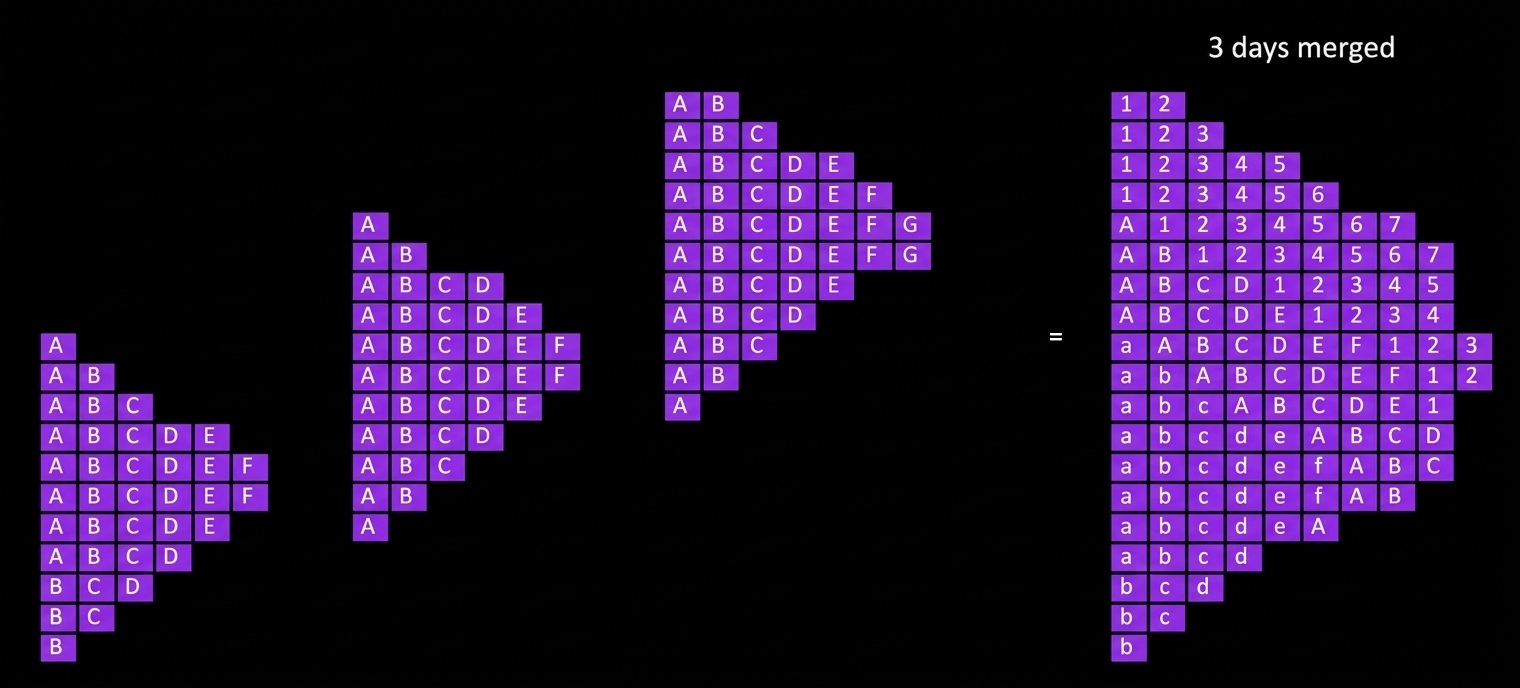
Merging Sessions
A standalone Regular Trading Hours (RTH) profile gives you the intraday picture...

![How To Use Market Profile [START NOW] | Trading Tutorials](https://i.ytimg.com/vi/bpravMgflLc/hqdefault.jpg)